Internet of Things (IoT) solutions involve significant quantities of data. When that data is all nicely sent up into a cloud (such as Azure) it is straightforward to analyze and monitor. However, many hybrid IoT scenarios involve on-premises data that is never sent up to the cloud due to available bandwidth, cost, or data volume. We may be only sending aggregations or exceptions to the cloud, but operations teams on-prem may be wanting insight into the full data that is being generated.
One way to monitor on-prem data is to leverage the Azure IoT Gateway that may be already in-place. The IoT GW provides a structured approach to consuming data on-prem, processing the data, and uploading the data to a cloud service (such as an Azure IoT Hub) via a module pattern. These modules can be devloped in Java, C#, Node.js, or C (or mix ‘n match).
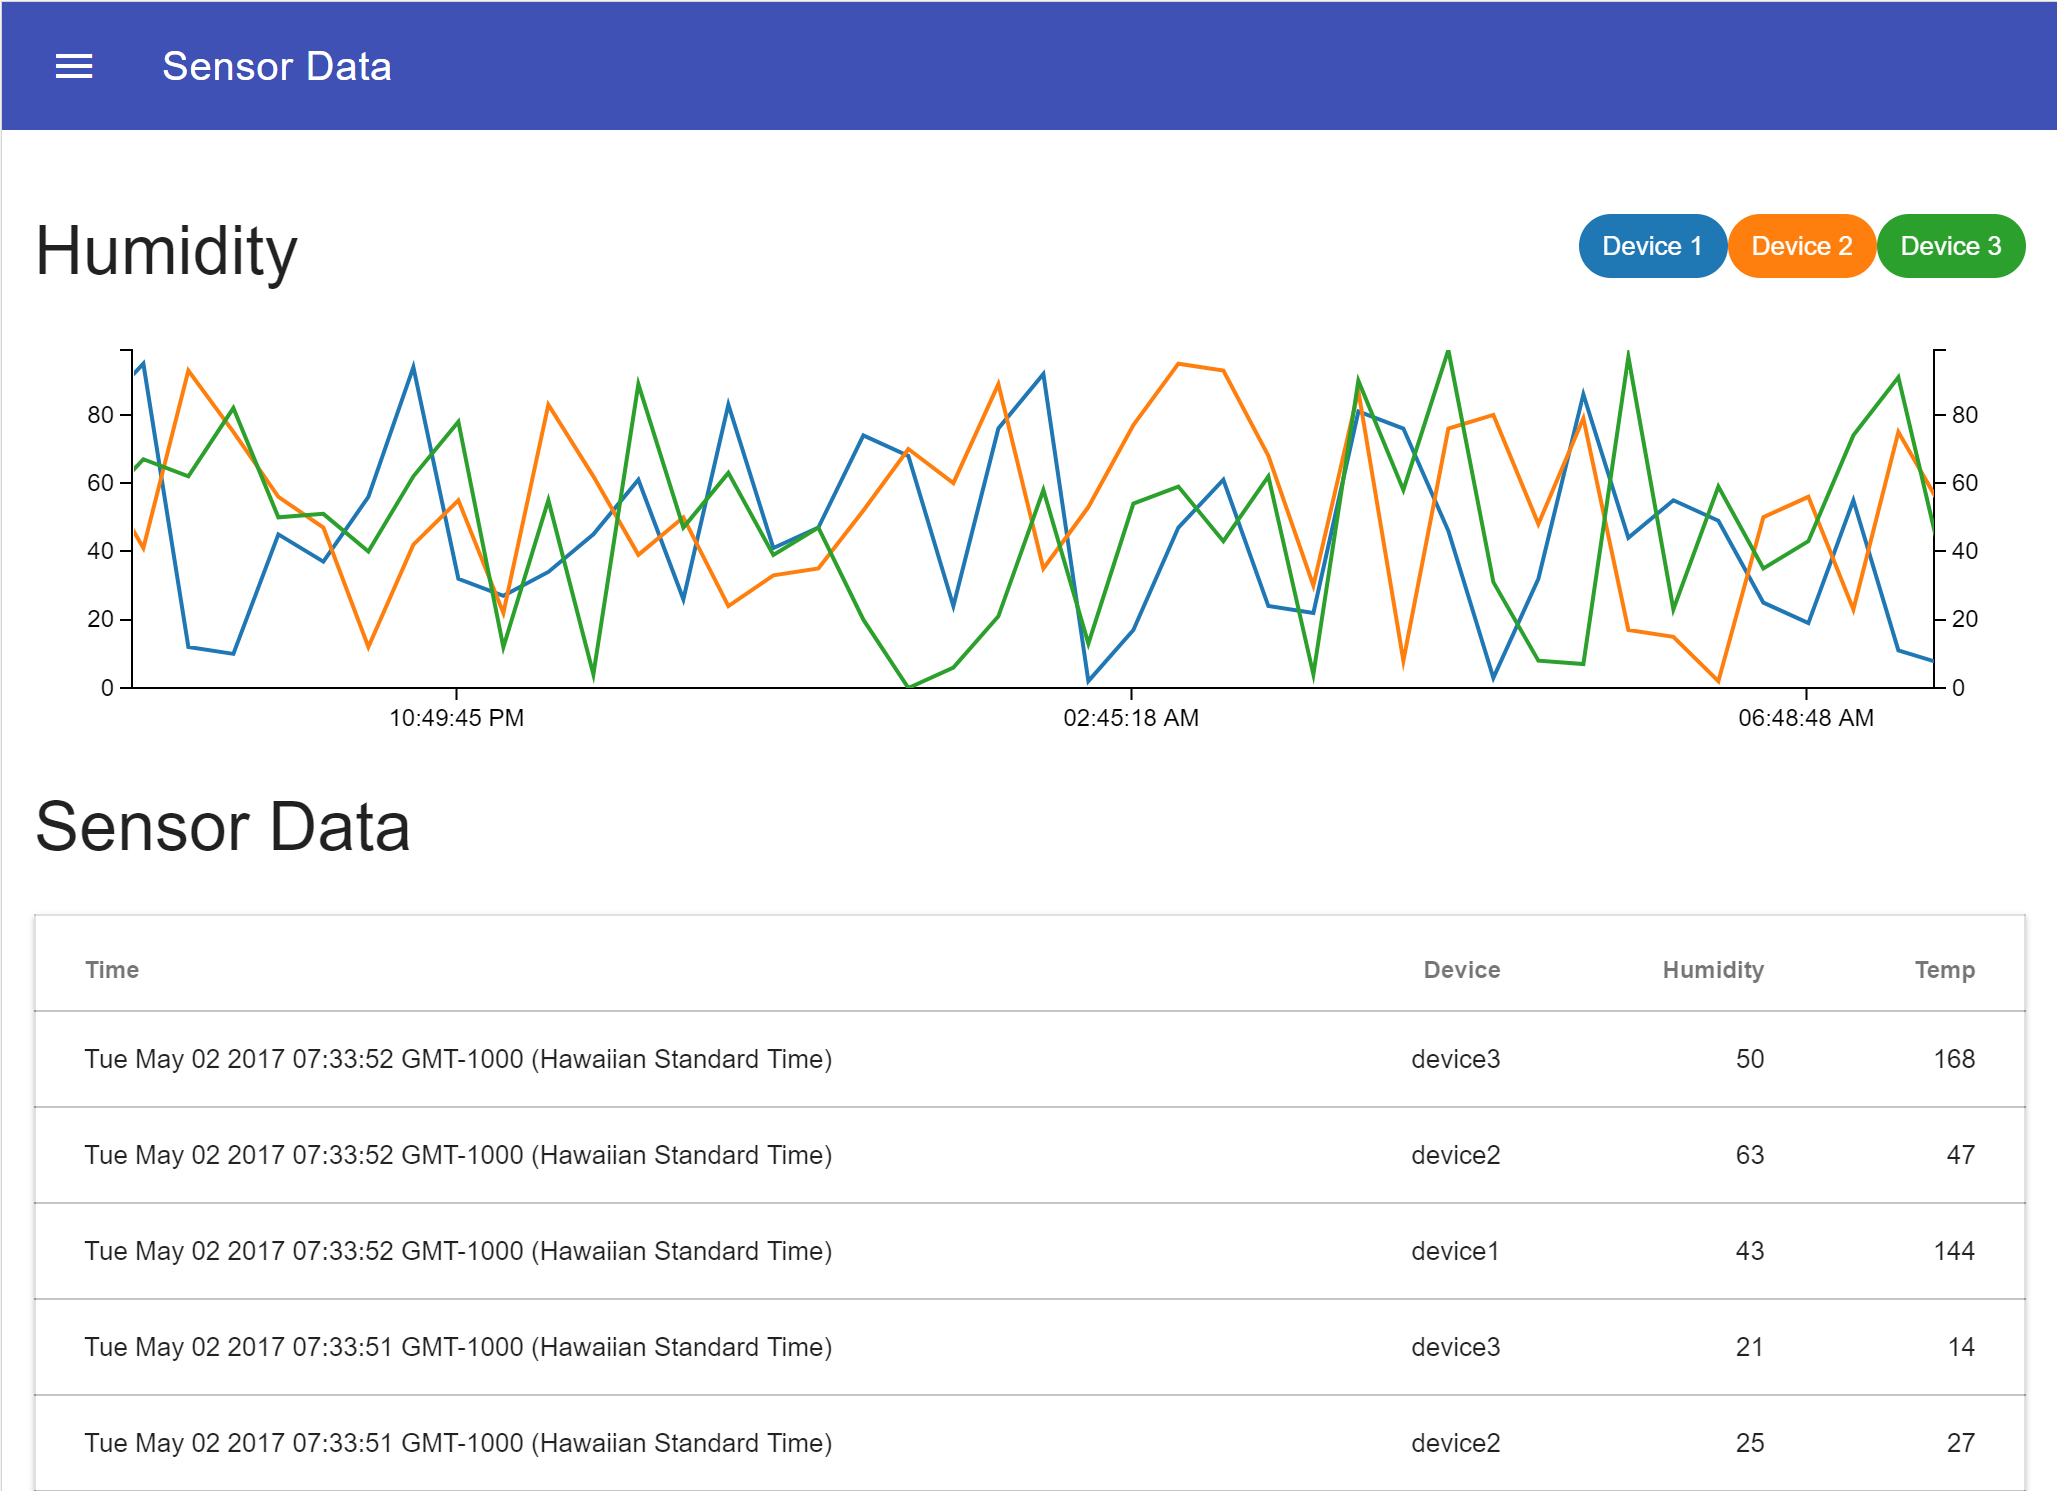
Today we will extend the IoT GW with a module to visualize the full fire hose of on-prem data before it is processed and batched for upload. We will do this by creating a Socket.io server that communicates real-time data over a WebSocket to an HTML page:
Run the Sample
The IoT team has provided a sample application to demonstrate how the gateway works. Follow the setup instructions for JavaScript and run the sample locally. Within a few minutes we get an IoT Gateway running, a module that generates sample device data for temperature and humidity, and a printer module that echoes the value into our terminal:
Not bad! However, reading a cavalcade of sensor data is difficult in a terminal window. Instead, we can pipe that data feed into a browser for a more visual take on the same information. First we will create a new module, then update the gateway configuration to leverage the new module.
Create the Socket.io module
The sample includes a printer.js module that receives messages from the pipeline and logs them to the console. We will improve on this but receiving the same messages, yet emitting them via Socket.io.
Create a new file in the /modules folder called socketio.js and paste the following code:
const io = require('socket.io')();

class SocketioModule {

    constructor() {

        // Default port for the Socket.io server
        this.port = 8000;

    }

    create(broker, configuration) {
        this.broker = broker;
        this.configuration = configuration;

        // Update port if provided as a configuration argument
        if (this.configuration && this.configuration.port) {
            this.port = this.configuration.port;
        }

        // Attach socket.io to a port
        io.attach(this.port);
        console.log(`Started Socket.io server on port ${this.port}`);

        return true;
    }

    receive(message) {

        // Convert data into an object
        let data = JSON.parse(Buffer.from(message.content));

        // Emit a message via socket.io
        io.emit('message', data);

    }

    destroy() {

        // Close socket on destroy
        console.log(`socketio.destroy`);
        io.close();

    }

}

module.exports = new SocketioModule();
Notice the syntax is a bit different? Gateway modules support the fancy new(ish) ES6 Class Syntax so we used that format
This new module is doing several things:
- Implements the methods that each module needs to have -
create()runs on startup,receive()processes a newly received message from the broker, anddestroy()tidies up on shutdown. See the devdocs for more details - Instantiates a Socket.io server
- The constructor sets a default port of
8000, or a custom port can be defined in theconfigurationargument ofcreate(). - When a message is received, a Socket.io event called
messageis emitted to the socket - On shutdown, the Socket.io server is closed
Be sure to use npm to install the Socket.io dependency in the /js folder of the sample:
npm install socket.io --save
Update the gateway configuration
Gateways take a configuration file, written in JSON, that handles 3 types of configurations:
- Sets up
loadersfor each programming language. If you are using a Java module, you need to load Java, etc. Only load languages that your modules are using. - Defines all
modulesto be used and any configuration arguments - Establishes relationships between modules via
linksthat define data from from Module A into Module B.
{
      "loaders": [],
      "modules: [],
      "links": []
}
Opening the gw.local.config.json file from our sample, replace the node_printer module with the new module we created in the modules array:
{
      "name": "node_socketio",
      "loader": {
        "name": "node",
        "entrypoint": {
          "main.path": "modules/socketio.js"
        }
      },
      "args": null
}
We gave a name value of
node_socketioto match the existing convention, but we could have named itsocketio,io, or anything else our hearts desired
The gateway now knows to load our module. To wire it into the pipeline, adjust the links section by replacing node_printer sink with our node_socketio.
The adjusted gw.local.config.json file now looks like:
{
  "loaders": [
    {
      "type": "node",
      "name": "node"
    }
  ],
  "modules": [
    {
      "name": "node_sensor",
      "loader": {
        "name": "node",
        "entrypoint": {
          "main.path": "modules/sensor.js"
        }
      },
      "args": null
    },
    {
      "name": "node_socketio",
      "loader": {
        "name": "node",
        "entrypoint": {
          "main.path": "modules/socketio.js"
        }
      },
      "args": null
    }
  ],
  "links": [
    {
      "source": "node_sensor",
      "sink": "node_socketio"
    }
  ]
}
Fun tip for links: use an
*undersourceto grab all traffic coming into the gateway without a predecessor module (example)
Restart the gateway
With our new module primed, and the configuration options updated, let’s restart our gateway. From the /js folder, run the start command from a terminal window:
npm run local
The gateway should startup and inform us of the configured Socket.io port:
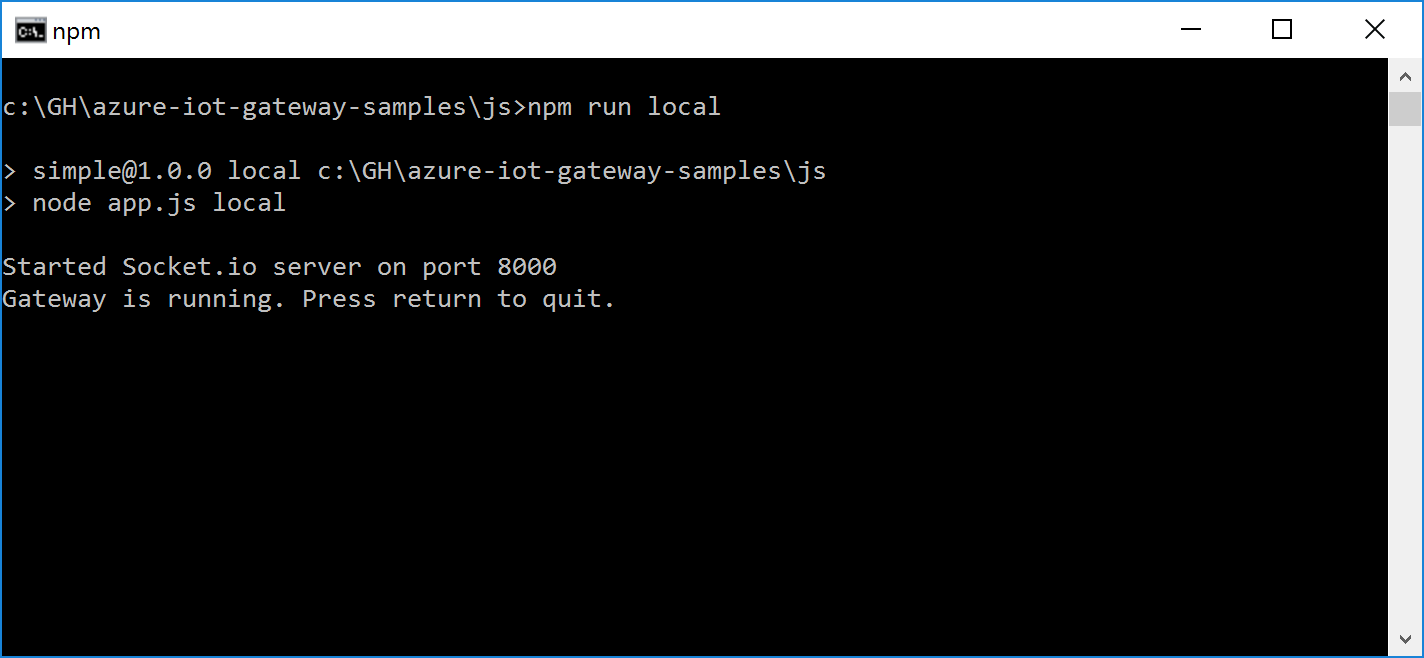
At this point the node_sensor module is generating sample data, but we are not echoing everything to the console since the node_printer module was removed.
Create a user interface
Our server is emitting events over a WebSocket, but we need a client to receive and visualize them. For this let’s use a simple HTML page. We can receive the events with Socket.io’s JavaScript library, and then visualize the data points with Epoch, a real-time charting library implemented in JavaScript. A smidge of jQuery will help with adding rows to a table, and Material Design Lite will provide some nice lipstick.
Create a new file in the /js folder named index.html and paste in the following code:
<!DOCTYPE html>
<html lang="en">

<head>
    <meta charset="UTF-8">
    <meta name="viewport" content="width=device-width, initial-scale=1.0">
    <meta http-equiv="X-UA-Compatible" content="ie=edge">

    <title>Sensor Data</title>

    <!-- CSS -->
    <link rel="stylesheet" href="https://fonts.googleapis.com/icon?family=Material+Icons">
    <link rel="stylesheet" href="https://code.getmdl.io/1.3.0/material.indigo-pink.min.css">
    <link rel="stylesheet" href="https://cdnjs.cloudflare.com/ajax/libs/epoch/0.8.4/css/epoch.min.css">

    <style>
        .demo-layout-waterfall .mdl-layout__header-row .mdl-navigation__link:last-of-type {
            padding-right: 0;
        }
    </style>

</head>

<body>

    <div class="demo-layout-waterfall mdl-layout mdl-js-layout">

        <!-- Header -->
        <header class="mdl-layout__header mdl-layout__header--waterfall">
            <!-- Top row, always visible -->
            <div class="mdl-layout__header-row">
                <!-- Title -->
                <span class="mdl-layout-title">Sensor Data</span>
                <div class="mdl-layout-spacer"></div>
                <div class="mdl-textfield mdl-js-textfield mdl-textfield--expandable
                  mdl-textfield--floating-label mdl-textfield--align-right">

                    <div class="mdl-textfield__expandable-holder">
                        <input class="mdl-textfield__input" type="text" name="sample" id="waterfall-exp">
                    </div>
                </div>
            </div>
        </header>

        <div class="mdl-layout__drawer">
            <span class="mdl-layout-title">Title</span>
            <nav class="mdl-navigation">
                <a class="mdl-navigation__link" href="">Link</a>
                <a class="mdl-navigation__link" href="">Link</a>
                <a class="mdl-navigation__link" href="">Link</a>
                <a class="mdl-navigation__link" href="">Link</a>
            </nav>
        </div>

        <main class="mdl-layout__content">
            <div class="page-content">

                <!-- Sensor Data Table -->
                <div class="mdl-grid">
                    <div class="mdl-cell mdl-cell--12-col">

                        <div>
                            <!--d3 Colors: https://github.com/d3/d3-3.x-api-reference/blob/master/Ordinal-Scales.md-->
                            <span class="mdl-chip" style="float: right; background-color:#2ca02c; color:#FFF">
                                <span class="mdl-chip__text">Device 3</span>
                            </span>

                            <span class="mdl-chip" style="float: right; background-color:#ff7f0e; color:#FFF">
                                <span class="mdl-chip__text">Device 2</span>
                            </span>

                            <span class="mdl-chip" style="float: right; background-color:#1f77b4; color:#FFF">
                                <span class="mdl-chip__text">Device 1</span>
                            </span>

                            <h3>Humidity</h3>
                            <div id="chart" class="epoch category10" style="width: 1000px; height: 200px; margin: 0 auto 20px"></div>
                        </div>

                        <div>
                            <h3>Sensor Data</h3>
                            <table class="mdl-data-table mdl-js-data-table mdl-shadow--2dp" style="width: 100%">
                                <thead>
                                    <tr>
                                        <th class="mdl-data-table__cell--non-numeric">Time</th>
                                        <th>Device</th>
                                        <th>Humidity</th>
                                        <th>Temp</th>
                                    </tr>
                                </thead>
                                <tbody></tbody>
                            </table>
                        </div>

                    </div>
                </div>

            </div>


        </main>

    </div>

    <!-- JS -->
    <script src="http://ajax.aspnetcdn.com/ajax/jQuery/jquery-3.2.1.js"></script>
    <script src="http://code.getmdl.io/1.3.0/material.min.js"></script>
    <script src="http://cdnjs.cloudflare.com/ajax/libs/socket.io/1.7.3/socket.io.min.js"></script>
    <script src="http://cdnjs.cloudflare.com/ajax/libs/d3/3.5.17/d3.min.js"></script>
    <script src="http://cdnjs.cloudflare.com/ajax/libs/epoch/0.8.4/js/epoch.min.js"></script>
    <script>
        var chart;

        // Change port from default 8000 if adjusted in server-side module args
        var socket = io('http://localhost:8000');

        // Process message when received from server
        socket.on('message', function (data) {

            // Echo message to console
            console.log(data);

            // Write data into new table row
            const time = new Date();
            $.each(data.content, function (i, data) {
                $('table tbody').prepend(`<tr><td class="mdl-data-table__cell--non-numeric">${time}</td><td>${data.sensorId}</td><td>${data.hmdt}</td><td>${data.temp}</td></tr>`);
            });

            // Keep a tidy number of 25 table rows
            $('table tbody tr').slice(10).remove();

            // Update dataset
            chart.push([
                { time: Date.now(), y: data.content[0].hmdt },
                { time: Date.now(), y: data.content[1].hmdt },
                { time: Date.now(), y: data.content[2].hmdt }
            ]);

        });

        $(document).ready(function () {

            // Create chart with Epoch
            chart = $('#chart').epoch({
                type: 'time.line',
                axes: ['left', 'bottom', 'right'],
                data: [
                    {
                        label: "Device 1", values: []
                    },
                    {
                        label: "Device 2", values: []
                    },
                    {
                        label: "Device 3", values: []
                    }
                ]
            });

        });
    </script>

</body>

</html>
(And yes, I’m sorry for inserting the JS into a HTML file, but it makes this demo easier :) )
This HTML page loads all our dependencies, then uses JavaScript to listen on the Socket for an emitted event. It then updates the chart and the table to add the data to the page.
Ensure the gateway is still running, and open this local file directly in a browser:
Wrap Up
Today we took the Azure IoT Gateway and created a custom module that exposes messages from the gateway broker to a WebSocket via Socket.io. We then attached a dashboard UI to visualize the data in real-time.
This scenario targets on-premises teams that want a real-time look at their gateway traffic, without standing up significant amounts of infrastructure, by tapping into the robust module structure of the IoT Gateway. While this was done totally in JavaScript, we could have used a variety of languages to build our custom module.
This module has been published on npm for ease of use and is available on GitHub (including a complete sample).
Thanks!